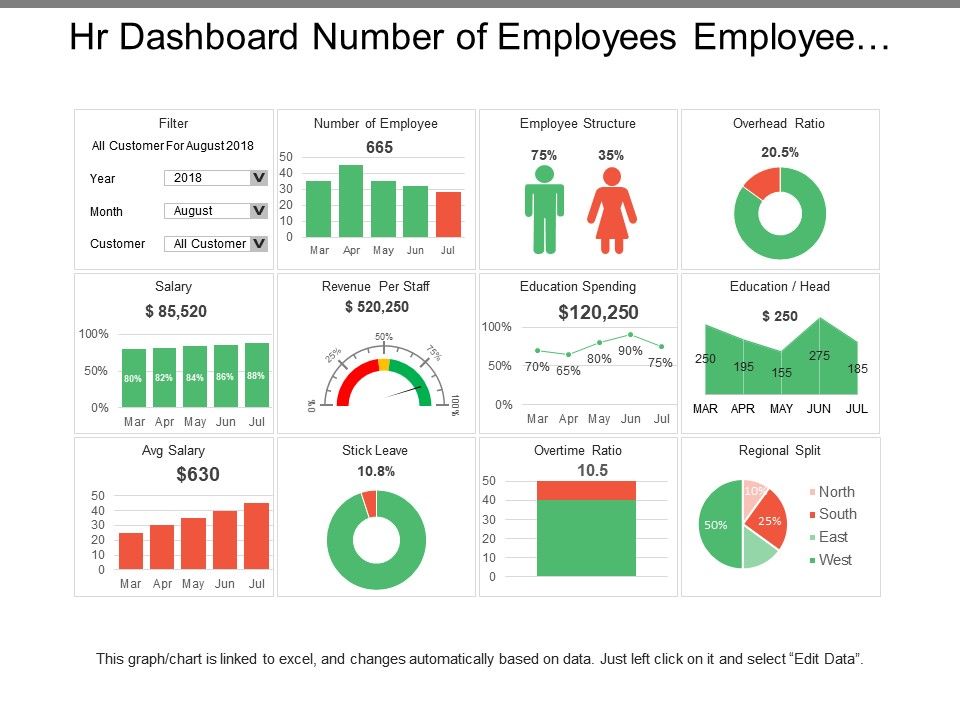
A dashboard is a type of graphical user interface which often provides at-a-glance views of key performance indicators (KPIs) relevant to a particular objective or business process.
A dashboard is a type of graphical user interface which often provides at-a-glance views of key performance indicators (KPIs) relevant to a particular objective or business process.
In simple term a user interface that gives a
Interactive dashboard Most Beneficial for
Dashboard Tools
Total Visibility into Your Business
Dashboard enables you to know exactly what is going in your business. You will be able to know where to give more attention and where not.
Big Time Savings
Just think day to day or monthly how much time either you or your staff spend creating reports in Excel or other spreadsheet programs? Any report that you create more than once should go in your dashboard. And once in your dashboard, frequency can be set to auto update the same.
Improved Results
Logically it’s fact that when you see your key metrics in your dashboard, you intuitively start improving your results. Example – red, green signs.
Reduced Stress
When constant monotonous job automated it really reduces the stress.
Increased Productivity
When stress get reduced automatically time used for productive business tasks which in turn increases the overall productivity.
Increased Profits
When right efforts given to required business activity at right time will surely increase profits.
We at CDC provide Interactive Dashboards to our clients which really satisfy their day to day need at one stop dashboard. Constant and consistent support to our clients making them tech-savvy by using smart dashboards for better decision making.
We offer following service
Challenges of Dashboard Reporting